The Self-Cultivation of Programmers: How to Use GDB Well
The title may sound a bit arrogant, but it is mainly a tribute to the book The Self-Cultivation of Programmers: Linking, Loading, and Libraries. In the AI era, we may increasingly let agents write and run GDB scripts or analyze core dumps for us. Still, this post discusses how to use GDB better: more specifically, how much of GDB's underlying principles we need to understand to know its capability boundaries and avoid being led around by AI on complex problems.
Preface
It is already the end of 2025. A quarter of this century has passed. More seriously, there may not be much time left before AI completes its ultimate plan to rule the binary world. If you do not believe that, just look at the heat around AI. So I want to keep up with the times and write a post about how to use GDB well in the AI era.
A few years ago, I saw a great YouTube video, Give me 15 minutes & I'll change your view of GDB. The title was not clickbait. It immediately made me realize a cruel fact: I was using a tool almost every day, but I still did not understand many of its details. In that moment, anxiety hit me. I secretly swore that I would study GDB deeply and become good at it.
Then I opened the official GDB documentation and community resources with ambition. After "careful reading", my mind was full of: there is so much content here. Even GDB maintainers probably cannot know every command and implementation detail. Maybe I will never master GDB in this lifetime. Maybe I should spend my time where it matters more. Hearthstone Battlegrounds, launch.
Since then, I have kept thinking about one thing: if I understand GDB's underlying principles well enough, then many GDB usage details, including niche tricks, may become only a matter of known unknowns. By known unknowns, I mean we clearly know what we still do not know. In some sense, this is a lower-end version of having everything under control. For GDB, a simple example is that I know GDB can interrupt a running program at a certain instruction, obtain a variable value, and perform custom checks. I just may not know the exact GDB command to do it.
Now that AI tools are popular, the cost of resolving known unknowns has been greatly reduced, while understanding underlying principles has become even more important. Only if we know how GDB works and where its limits are can we correctly reject AI's conclusions when it becomes unreliable, and turn GDB into a real weapon instead of being led around by AI.
I have not analyzed a core dump from scratch by myself for a long time. AI Agents usually do it now. Even with missing information, they can quickly locate the crash point and produce reasonably reliable analysis based on the source code. But AI is definitely not omnipotent. Some cases are painful. If our understanding of the principles is wrong or incomplete, AI can easily lead us into a dead end.
More broadly, I think this pattern will become common in many technical fields: understanding low-level details lets us ask better questions, and AI tools help us solve real problems faster. In plain words: theory tells us where to look, and practice tells us whether we were right. We still need both. If we only talk about theory and never touch the tool, our understanding can easily drift away from reality.
Around the year before last, I was bored and wrote a minimal GDB-like debugger in Rust. It was ugly, both in functionality and implementation, so I never wanted to open-source it. But luckily, AI coding tools were not yet popular, so I had to hand-write everything and hit many pitfalls. I learned quite a lot. Recently, while writing my personal project ghostscope, I have also been digging into GDB implementation details. These experiences made me want to write this post: what is behind GDB, and how that understanding helps me use it better. If anything is wrong or incomplete, feel free to email me.
Fog of War in Binaries
Some readers may still be here mainly to see the punchline. Isn't GDB's underlying principle just using system calls such as ptrace to control or even change process execution, and to obtain variables or call stacks?
The point I want to make is this: GDB's core job is mapping cold machine state back to the source-code world we understand. So the core of GDB is actually DWARF, the debug information we often hear about, not ptrace. ptrace is only one mechanism GDB uses to control a process and read or modify its memory.
About DWARF Debug Information
When I first learned programming, I knew about debug information like most people. But I did not really understand what it was. My understanding was limited to two points:
- I can use
readelf -S {binary}to inspect an executable or shared library. The many sections starting withdebug_are debug information.- To use GDB comfortably, we need this debug information. In other words, we need a Debug build, so remember to compile with
-g.
Beyond that, I knew nothing about how DWARF is generated, whether DWARF is cross-platform, or how GDB uses DWARF. This lack of knowledge made it hard for me to fully use GDB's abilities. For example: if debug information is missing, what useful information can GDB still obtain? That question alone would have defeated me at the time.
I first truly noticed DWARF when I watched an OpenResty technical talk. The phrase "elves and dwarves" suddenly woke me up. I do not know who originally made the joke, but the idea that DWARF dwarves could sit at the same table as ELF elves made me genuinely interested in DWARF. After all, ELF is the organization format for file information on Linux. Compilers, linkers, and loaders all work around it. The interview questions derived from it alone force us workers to treat its details seriously. Jokes aside, I believe understanding low-level details has a crucial influence on engineering ability and taste.
Source Code -> Executable File -> Process
Normally, I should start introducing DWARF technical details and how DWARF works. Before that, I want to discuss a few familiar things. AI can explain them in more detail than I can, so I will go straight to the key points.
As mentioned above, the role of GDB, or a debugger in general, is to map a process's runtime state at a certain moment back to the source-code world. More specifically, many debugger capabilities, such as symbol lookup, variable inspection, and stack unwinding, rely on DWARF. So we need to understand the transformation from source code to executable file, and then to runtime process, to understand what information DWARF preserves and how it preserves it.
Source Code -> Executable File
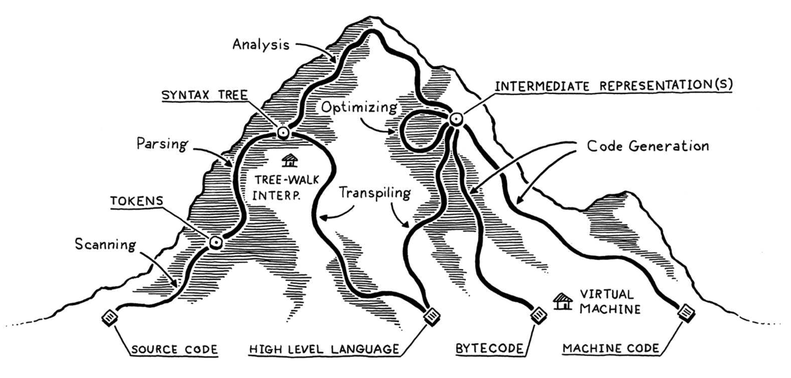
Everyone has heard the C compilation pipeline: preprocessing, compilation, assembly, and linking. Everyone has also heard Java's "write once, run anywhere". Here I want to show a diagram from Crafting Interpreters. Almost every language can find its path in that diagram. Whenever I encounter compilation-related problems, this picture is the first thing that appears in my mind.
Because the -g compile option generates debug information, and ELF contains DWARF-related sections, DWARF is generated by the compiler during compilation. We can further understand that for any compiled programming language, source code is ultimately converted into machine code. A lot of source-level information is stripped or optimized away. The answer to how DWARF helps GDB map machine code back to source code becomes clearer: the compiler records stripped information in DWARF form.
Some people may also wonder: can GDB debug compiled languages beyond C/C++? More painfully, can GDB debug scripting languages such as Lua or Python? We will discuss these questions later.
Executable File -> Process
On Linux, executable files are started by the execve system call. This involves lots of work by the OS loader and the runtime dynamic linker. Books such as Loader & Linker and The Self-Cultivation of Programmers: Linking, Loading, and Libraries have already described many details, so I will not repeat them. The latter book is also what this post title pays tribute to.
That book contains one sentence that impressed me, roughly: an excellent programmer can understand every byte in the executable they write. I used to treat it as inspirational rhetoric and laugh it off. But in the AI era, the difficulty has been lowered a lot. Often, it only depends on whether we have the need.
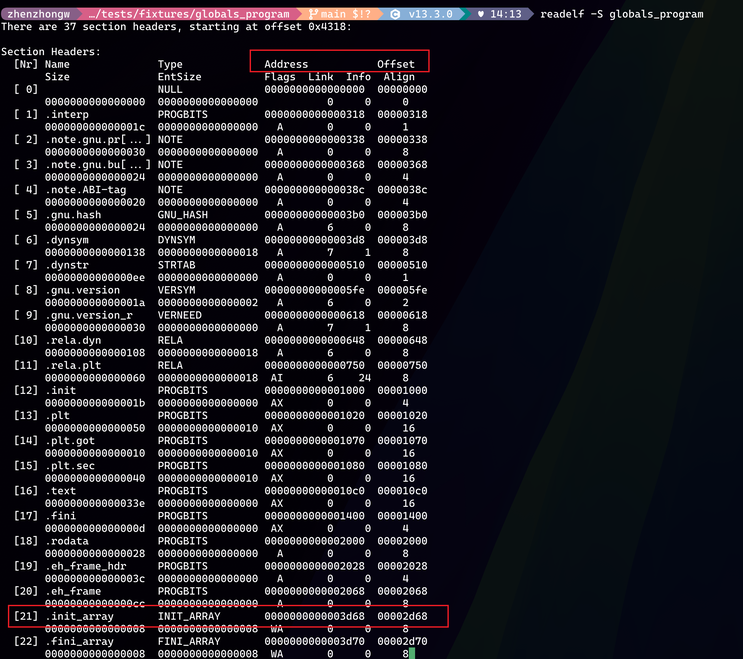
The picture below shows where DWARF information lives after an executable or shared library is compiled: the sections starting with debug in the red boxes. Here I want to clarify a common misconception: the difference between symbol table and debug information. Generally, .symtab is what we call the symbol table. Whether it exists depends on whether the executable or shared library exposes global or even local symbols. But the symbol table and debug information are different. The biggest difference is that the symbol table carries far less information, because the symbol table exists for linking and relocation, while debug information exists for runtime source-level reconstruction.

Before discussing how an executable is mapped into a process, I want to focus on two important concepts. Every time we run readelf -S {binary} to inspect section details, we often see two attributes: Address and Offset.
Offset is easy to understand: it is the real offset of the section in the file. These sections are real binary data, except things like .bss, so they are stored in the executable's file contents. Address means the virtual address where the section will be loaded. It is sometimes called VMA, Virtual Memory Address. The immediate question is: why is this Address so small when the pointers we see in a process are usually huge numbers?
The answer is simple: the executable has not yet been loaded into a real process virtual address space, so the Address recorded in the executable can only be a relative offset. We can call it Link-time Address. The pointer values we print or inspect during debugging are Runtime Address, because the loader allocates virtual addresses again and maps data from the executable into the process's virtual address space. The relationship is: Runtime Address = Load Base + Link-time Address.
This assumes the executable is PIE, which most Linux distributions enable by default. If it is non-PIE, no base-address conversion is needed. How do we obtain the base address? Debuggers usually read /proc/<pid>/maps to get the load base of an executable or shared library. There are other ways, but LLMs can easily answer those.
By the way, if someone notices that addresses of fixed global variables differ every time the process starts, thank Linux ASLR, Address Space Layout Randomization. The process base address is randomized on each run. For debugging convenience on a test machine, we may consider disabling ASLR. Great undertakings do not worry about small details.
Another question: many sections have identical Address and Offset, but sometimes they differ. For example, in the second red box above, .init_array has different Address and Offset. Why?
I can understand why sections after .bss have different Address and Offset. .bss saves executable file size, but when loaded, the corresponding variable length must still count toward virtual address space. Maybe that is why .bss is often placed last among sections. This is just my guess. But why is .init_array different?
The following readelf -l output helps. The red-boxed LOAD entries correspond to ELF regions that need to be loaded. The fourth LOAD's VirtAddr, the Link-time Address, is exactly .init_array's Address, 0x3d68. So .init_array is in the fourth LOAD. That LOAD has RW permission, while the previous one is read-only. These LOAD regions are mapped by the loader using mmap, and mmap creates page-aligned regions. Different permissions require separate mmap calls. So .init_array naturally shifts by one page to allow a new mapping.
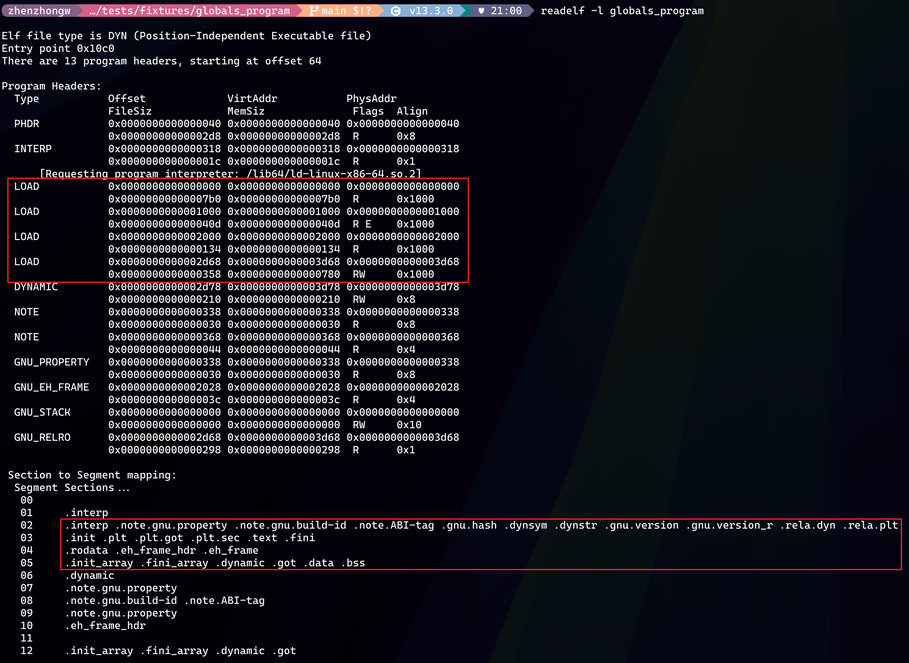
But someone may ask: why not start directly at the next page, 0x3000, instead of calculating .init_array as 0x3d68?
This is an interesting question. ELF loading usually uses file-backed mmap. Page-table mapping is created page by page. Each virtual page maps to a page in the file, with the file offset rounded down, and the offset inside the page must stay the same.
That means the k-th byte inside the file page can only map to the k-th byte inside the virtual page. You cannot move file page offset 0xd68 to virtual page offset 0. So Address % page_size == Offset % page_size must hold, and the segment start Address lines up with file offset Offset. Does the space from 0x3000 to 0x3d68 waste anything? It is only virtual address space, so it does not matter much and does not waste physical memory.
Finally, how can we verify whether the above is correct? If interested, let AI guide you. Ask AI to generate a test program. After running it, use commands such as xxd to inspect executable contents, and use GDB to inspect corresponding addresses in the running process virtual address space. Check whether both sides contain the same data and whether the loading behavior matches this model. This is what I called using technique to verify principle: hands-on practice to check theoretical understanding, especially to find where our understanding is wrong or shallow. AI greatly reduces the cost of that process.
Some Answers Become Clear
-
DWARF does not affect program execution. DWARF-related sections only have
Offsetvalues, while theirAddressvalues are 0. That means DWARF sections are not actually loaded, so they naturally do not affect process execution. -
We can now more clearly understand the broad difference between Release and Debug builds. Some people think only Debug builds can be debugged, but that is wrong. Broadly speaking, Release and Debug differ mainly in compile options. Release may enable higher optimization, may not use
-gto generate DWARF, or may strip the symbol table and DWARF. This does not mean Release builds cannot support debug information or cannot be debugged. Specific Release/Debug differences still depend on the project. Some projects use macros to change behavior between Release and Debug, which is another topic. -
We have uncovered half of
addr2line's principle. This tool uses DWARF to convert instruction addresses into source locations. Sinceaddr2lineis used against executable files, the instruction address here must beLink-time Address, notRuntime Address, and also not the instruction's file offset. Although they are often the same, you can run a non-PIE program to see the difference clearly. -
When a process crashes, people often check the system command
dmesgoutput. A line may look like this:a.out[4101063]: segfault at e9 ip 00005b76a99ad13d sp 00007ffef3417330 error 6 in a.out[5b76a99ad000+1000] likely on CPU 0 (core 0, socket 0)Here
ipandspare the instruction pointer and stack pointer. Since the process has already exited, without a core dump we do not know the base address ofa.outin that process's virtual address space. So instruction pointer0x00005b76a99ad13dis only aRuntime Addressand is not very helpful by itself.The final
a.out[5b76a99ad000+1000]is useful: the kernel code here prints the start virtual address and length of the VMA containing the instruction pointer. But simply subtracting the VMA start from the instruction pointer still does not give theLink-time Address, because we still need the base address.A trick is to read the executable with
readelf -l, use the program-header offsets to infer the first LOAD program header, and treat it as the base. Once we know one LOAD'sRuntime Address, the others are easy to compute. After we get theLink-time Address, we can useaddr2lineto get the source line, or useobjdumpto inspect the corresponding assembly. -
Why did I spend so much space on address conversion from executable file to process? Because debuggers need to do the same work. If we know how addresses are converted and what information is needed, we can use debuggers better, and it prepares the ptrace discussion below. Especially when information is missing and the debugger "goes on strike", these details help us decide what reliable information we can still get under constraints. I did not discuss runtime dynamic linking or PLT/GOT here because I do not think they are central for this debugger discussion. If interested, read the two books mentioned above.
GDB's Backend Capability
What does GDB backend capability mean? This is not the frontend/backend split in web development. I learned the framing from Linux tracing systems & how they fit together, which divides dynamic tracing into frontend, data source, and backend. I find that layered view useful.
GDB, as a debugger, differs a lot from dynamic tracing technologies such as eBPF and SystemTap, but it still belongs to the broader tracing/debugging family. On Linux, the underlying capability GDB depends on is ptrace. More specifically, ptrace provides three core abilities:
- Intercept key events in the traced process, such as system calls and signals.
- Stop, resume, and single-step the traced process.
- After stopping the traced process, read and write its registers and memory.
The familiar GDB breakpoint relies on ptrace abilities 2 and 3. The traced process stops at a certain instruction. For that process, the world is frozen. GDB then reads key information and displays it according to user commands. How does stopping work? GDB uses ptrace to modify the instruction at the desired breakpoint and changes the first byte into a trap instruction, int3 on x86-64. When the CPU executes it, an exception occurs, and the kernel notifies GDB with SIGTRAP.
This feels familiar. System calls also use specific machine instructions to switch from user mode to kernel mode. So how does GDB monitor system calls? Would it conflict? The implementation relies on kernel notification in the common system-call path, instead of directly modifying the monitored process's system-call instructions. That is ptrace ability 1. The familiar strace is also implemented on top of ptrace this way.
Another question: at what level does ptrace instruction modification happen? Does it affect other processes running the same binary? First, the instruction address ptrace needs is the Runtime Address mentioned above, the user-space virtual address of that process. The write means the kernel finds the VMA containing that address through the process's mm_struct and modifies the instruction. Since threads share the same virtual address space, this affects all threads in the process. For .text mappings of executables and shared libraries, they are usually MAP_PRIVATE file-backed pages, so writing triggers copy-on-write: a private page is copied for the current process and the page table is updated. It neither modifies the binary file on disk nor usually affects other processes that load the same file. Also, although .text is loaded read-only, ptrace writes from kernel mode. The read-only protection is for user mode, so this is fine.
After briefly discussing ptrace, the familiar GDB backend, I want to also mention how GDB's watch command works. watch is very useful. It monitors whether a memory range is read or written, giving us a trigger event beyond ptrace breakpoints, signals, or system calls.
When I first learned watch, I was curious how it was implemented. If it relied purely on ptrace, it would have to single-step instructions, check memory after each instruction, and performance would be absurdly bad. Later I learned that GDB watchpoints rely on CPU hardware. When GDB registers read or write monitoring for a memory range, the CPU checks whether executed instructions meet the condition. In a sense, GDB watchpoints do not rely mainly on ptrace, so they are another backend capability of GDB.
Here is a useful example. GCC supports the -fstack-protector option, which detects whether out-of-bounds writes corrupt the function stack. Roughly, the function prologue stores a random value on the stack next to RBP and the return address. If a local variable overflows, since the stack grows from high addresses to low addresses, it may corrupt this random value. The program can then report the problem directly instead of failing mysteriously later.
How do we use watch here? Set a breakpoint at the function prologue. When it triggers, disassemble the prologue and locate the random value, the canary, on the stack. Then directly watch that memory address and resume execution. Wait for good news, meaning find who corrupted the canary. Someone may ask: if the problem is in the same function, can't we see who corrupts the stack by reading code? But what if the function is complex or calls other complex logic? If I have a method that can catch the problem with certainty, why rely on eyesight? Just watch it. Performance concerns aside, it is simple.
DWARF Debug Information
If we ask AI about all the debug_ sections, it can explain each section well. But I want to connect these sections by looking at how GDB uses DWARF to implement core functions.
Where Should a Breakpoint Be Placed?
We now know ptrace basics. What does GDB need to do before using ptrace to set a breakpoint?
Breakpoints are usually specified by function name or by source file and line number. ptrace ultimately modifies instructions at a Runtime Address. So the first thing GDB must do is convert a function name or source line number into a Runtime Address. Users can also compute the address themselves and set a breakpoint directly, such as break *0x00005555555553cd, placing the breakpoint at the machine instruction at that address.
How does GDB find the Runtime Address corresponding to source code? The answer is both simple and not simple. DWARF's debug_line section maintains the mapping between source line numbers and machine instruction addresses, officially called Line Number Information. The debugger queries this information. Someone may say they can still set a breakpoint on a function without debug information. That is because the function can be found in the executable's .symtab symbol table. But for source-file and line-level breakpoints, we still need debug information.
How does debug_line record this mapping? The interesting part is not the decoded output from readelf --debug-dump=decodedline {debuginfo-file}. DWARF does not store a simple mapping table. It uses a compact state-machine instruction format instead. The reason is simple: complex programs have a lot of Line Number Information, and DWARF needs to keep debug info from exploding in size. Machine instruction addresses usually grow continuously, and source line numbers usually increase sequentially. So after the state machine records the source file, line number, and instruction address initially, later records often store only deltas, such as how much the line number increases and how much the instruction address increases. This reuses repeated information and stores data efficiently.
The address recorded in Line Number Information is the instruction Address in the executable file, not Offset. So after querying the Address corresponding to a source line, GDB still needs to convert it into the process Runtime Address.
Line Number Information also contains interesting fields. Besides line number, it keeps column number. If code is written with multiple statements on one line, or if there is a function-call chain, the column helps identify the exact source location corresponding to an instruction. Another useful field is is_stmt, which means whether the instruction is the logical starting point of that source line. A high-level source line can compile into multiple instructions. For pseudo-code a = b + 3, the compiler may generate instructions to load b, perform addition, and store the result into a. If the debugger stops at an arbitrary instruction, variable contents may not match user expectations because the source statement is in an intermediate state. With high optimization and instruction reordering, reasonable breakpoints are even harder without is_stmt.
GDB's step command also depends heavily on is_stmt. ptrace only provides instruction-level single-step, while GDB step provides source-level single-step. GDB must carefully decide how many instructions one step should execute. It also cannot simply execute all instructions for the current source line, because one line can contain multiple source statements. Even if nobody should write code like that, classic for loops such as for (int i = 0; i < 100; i++) exist. During debugging, nobody wants one step to finish the entire loop header.
One question remains: if Line Number Information is stored by a state machine, how can we quickly query the address for a source line we care about? Linear storage means O(n) lookup, while we want something closer to O(1). Do we need to parse all Line Number Information and build our own lookup table? That can be wasteful, especially when users only set a few breakpoints.
DWARF's answer is simple. Use the file name to quickly find the corresponding Compile Unit in .debug_names. Then find that Compile Unit's DW_AT_stmt_list attribute, which gives the offset of its Line Number Information in debug_line. Then parse only that Compile Unit's line table to find the address. This introduces several concepts. A Compile Unit is the top-level structure in DWARF, usually stored in debug_info. More concretely, in C/C++, each C or C++ source file corresponds to one Compile Unit. .debug_names helps quickly find the offset of a Compile Unit inside debug_info.
At this point, we have also found the remaining piece of how addr2line works. Given an Address, addr2line uses a section like .debug_aranges to quickly find where the corresponding Compile Unit is in debug_info, then finds the line-table offset in debug_line, parses it, and obtains the source file and line for that instruction.
Where Are Variables?
Now GDB faces the second problem: when a breakpoint triggers, where in process virtual memory are the visible variables and parameters for that source line located at that exact moment? Only after knowing those addresses can GDB use ptrace to read the data or modify it according to the user's wishes. Again, the key is DWARF. DWARF is the map guiding us through the dark.
Someone may say bpftrace can read parameter contents without debug information, using variables from arg0 to argN. For example:
sudo bpftrace -e 'uprobe:/bin/bash:readline { printf("readline called, arg0: %s\n", str(arg0)); }'
bpftrace can do this thanks to the ABI, Application Binary Interface. The ABI defines platform calling conventions. Whether for system calls or normal function calls, function-entry arguments follow rules. On AMD64, the first function argument is in RDI. If the function address can be found through the symbol table, then without debug information we can still capture such arguments through bpftrace. GDB can do the same.
But that is only the simplest tracing/debugging scenario. What if GDB stops at a source line, not at function entry, and wants to inspect a local variable rather than a global variable or parameter? As code executes, by the middle of a function the parameters may no longer stay obediently in the registers specified by the calling convention. This is when debug information comes to the rescue.
What does DWARF do? In one sentence: it records where variables and parameters live when each instruction executes. That is a huge amount of information, and storing it naively would not work. DWARF's solution is cool: it directly defines a small stack-based virtual-machine language. This VM language describes where a variable lives within a certain instruction range, which saves a lot of space. It makes debugger parsing harder, but I think it is worth it because DWARF parsing is not a high-frequency operation and users usually inspect only a limited amount of information during debugging.
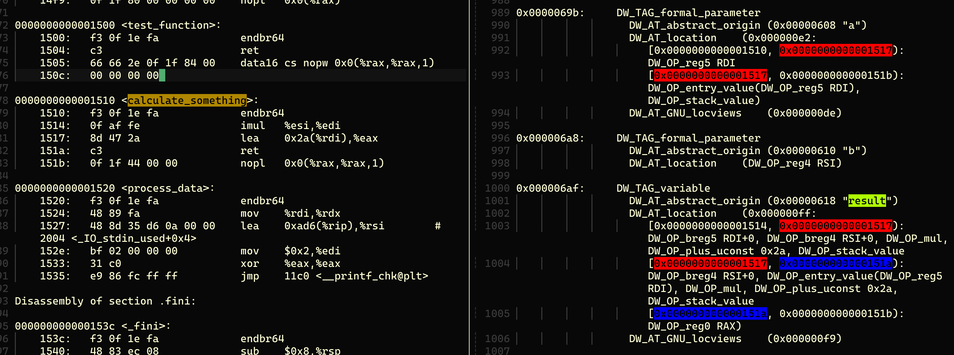
Now we need several concepts. The most important section is .debug_info, the core section in DWARF. It is basically a tree. Each tree node, or basic unit, is a DIE, Debugging Information Entry. A Compile Unit is also a DIE, of type DW_TAG_compile_unit, representing a source file. Functions defined in that source file are child nodes under the Compile Unit. Function parameters and local variables are child nodes under the function. As shown in the dwarfdump output below, the calculate_something function and its variables are recorded in debug_info.

After finding a function's DIE by function name within the Compile Unit, its type is DW_TAG_subprogram. It has a corresponding pc range, which is the instruction-address range. Each variable DIE records the variable name and, most importantly, DW_AT_location, describing where the variable is.
Because calculate_something is simple, the result variable is described as DW_OP_fbreg -20, a piece of VM bytecode. It means the variable is at frame base minus 20. In this function, result is always stored on the stack. What is frame base? People may say just check the current RBP register. That is true only if the compiler did not optimize away RBP. If RBP is optimized out, how do we obtain the frame base? We will briefly discuss this in the stack unwinding section.
Now consider a Release build, or more precisely, a build with high compiler optimization. This is the complex case that confuses many people. Can DWARF still provide source-level mapping under high optimization? The answer is yes.
In the picture, the result variable has three location expressions, each corresponding to a different instruction-address range. The expression DW_OP_breg5 RDI+0, DW_OP_breg4 RSI+0, DW_OP_mul, DW_OP_plus_uconst 0x2a, DW_OP_stack_value clearly says result is not stored at any virtual address. Instead, it can be calculated as result = $RDI * $RSI + 42, corresponding to the source code result = a * b + 42.
The second expression changes slightly. RDI changes from DW_OP_breg5 to DW_OP_entry_value(DW_OP_reg5 RDI). This is interesting because in that instruction range, RDI has been clobbered. The assembly on the left shows why: imul %esi,%edi modifies RDI. So DW_OP_entry_value(DW_OP_reg5 RDI) means the value of RDI at function entry, or during the function prologue. For GDB, finding that old value can be difficult, especially under high optimization, because those variables may not be placed on the stack at all.
This is why many variables in GDB show as optimized out under high optimization. The compiler optimized the variable away, so the debug information naturally has no location record. You cannot record something that no longer exists. Or, as in the example above, RDI was overwritten. DWARF says to use the entry value, but we may no longer be able to recover it. Why does this not affect the program? Because only useless things are optimized away. This sentence reads strangely. Maybe one day I will also be optimized away. A friendlier version: if something is optimized away, it may not be useless, but there is a substitute, and we can inspect the substitute.
What about static or global variables? The idea is similar but simpler. These variables are not on the stack or in registers. They are in sections such as .data or .bss. In other words, their lifetime is global. Finding their addresses is much easier. The symbol table or offsets recorded in .debug_info can usually locate them, and then the base-address conversion described above gives their process virtual address. If we also discuss special variables like TLS, I am getting tired, so let's pretend they do not exist for now.
Memory Layout
After finding a variable address, there is another problem: if the variable is not a primitive type such as int or char, but a complex user-defined structure, how do we know which fields it has, what their types are, and what their memory layout is? Without this information, even if we have an address, we cannot present the variable's source-level meaning faithfully.
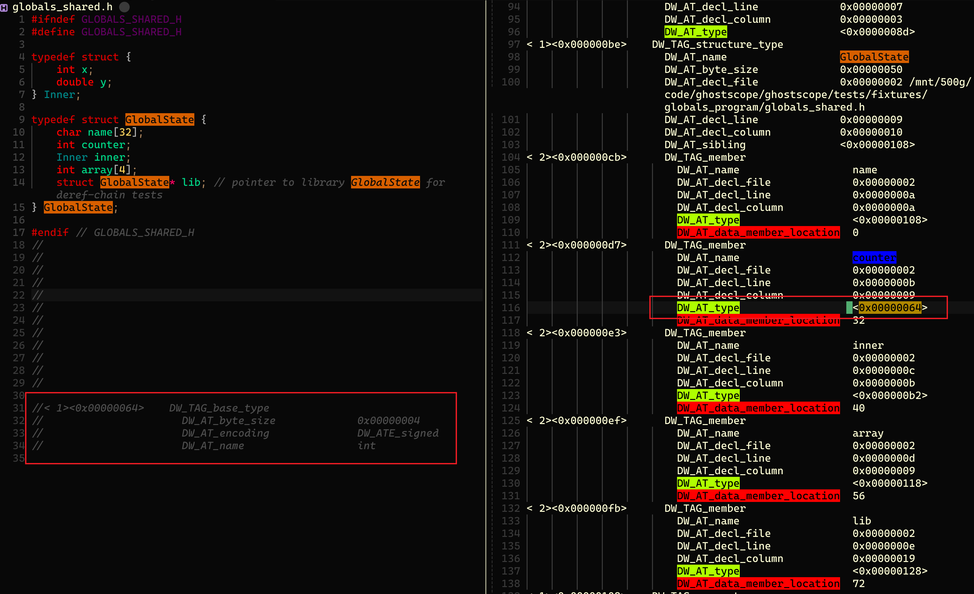
Type memory layout is also stored in .debug_info, represented by DIE attributes. As shown, DW_TAG_structure_type represents a user-defined data structure. DIEs of type DW_TAG_member represent its member variables. DW_AT_data_member_location describes the member's offset inside the structure. DW_AT_type is even more important: it points to the member type's location in DWARF. The left red box follows that pointer to the type information for the first member, counter. It is clearly a 4-byte signed integer. Following this idea, all variables can be displayed accurately according to memory layout descriptions in DWARF.
With this understanding of memory layout, pointer usage becomes clearer. Even when debug information is missing, if we have a low-level intuition for structure alignment and offsets, we can manually cast pointers in GDB and inspect the variable contents we care about.
Stack Unwinding
Another very important topic is stack unwinding. When debugging, looking at the call stack often gets us most of the way there. Flame graphs are also based on call stacks. But stack unwinding is complex, and this post does not want to cover it fully. Instead, I want to recommend several posts I have read. They explain stack unwinding clearly, although I still do not understand every detail.
The Return of the Frame Pointers. This post introduces the most general and convenient stack unwinding method: using frame pointers. It also reviews why compilers stopped generating frame pointers for performance and looks ahead.
Unwinding the stack the hard way. Besides frame pointers, we can rely on the
.eh_framesection for stack unwinding. The post describes many implementation details. The core data in that section,call frame information, is still DWARF. So the technique is essentially stack unwinding based on DWARF.DWARF-based Stack Walking Using eBPF. This also focuses on DWARF-based stack unwinding, but implements it with eBPF. Considering eBPF limitations, this is challenging. parca-agent has implemented this approach and even supports stack unwinding for some VM languages. Very cool.
DWARF Multi-Language Support
Now we can answer earlier questions. Does GDB support compiled languages beyond C/C++? Yes. Go and Rust can both be debugged with GDB. This is because DWARF is designed to be general, not tied to a specific programming language. More specifically, DWARF describes the logical structure and memory layout of code. How that data is interpreted depends on each language.
For example, a 32-bit signed integer is int in C and i32 in Rust. DWARF does not hardcode the language type name. It describes the type's attributes and size. So C int and Rust i32 both become a 4-byte type with attribute DW_ATE_signed. DWARF has more type attributes, such as boolean, floating point, and pointer, which gives it the foundation for multi-language support.
Rust also has more complex types such as enum, whose meaning depends on specific values in memory. This reminds me of how the Lua VM implements types. DWARF leaves this freedom to languages and provides designs such as DW_TAG_variant_part. I will not expand on that. In the end, GDB restores source-level semantics according to each language's own semantic rules.
Next question: do VM-language debuggers use DWARF? For languages such as Java, Python, or Lua, the answer is no. DWARF mainly describes machine instructions and what source-level information data at a memory address corresponds to. VM languages are their own world. Their source-level semantics are meaningful inside VM bytecode. More importantly, VM languages often have GC and JIT. Both dynamically change the source meaning of memory at runtime. Recording all of that in DWARF would be too complex. It is better for the debugger to ask the VM for help and reconstruct source-level semantics directly, instead of using DWARF as the map.
I remember an OpenResty production service crash long ago. When I entered GDB, the call stack only showed that Lua FFI called C code and crashed. That was not very helpful because the business logic that triggered the crash was in Lua code, and the Lua call stack was hidden inside the Lua VM. GDB could only see the Lua VM execution chain. Crashes were frequent, and we needed to quickly confirm the cause to stop the bleeding. I pulled out a GDB script I often used. It directly inspected the internal state of the Lua VM instance Lua_State and obtained the Lua call stack, letting us identify the root cause quickly.
Summary of DWARF Sections
After analyzing GDB's core functions, we now understand most DWARF roles. I think DWARF-related sections can be grouped into three categories:
- Core information storage: for example,
debug_lineanddebug_infomentioned above, anddebug_frame, similar toeh_frame, which stores stack unwinding information.- Query acceleration:
debug_arangescan quickly find the Compile Unit location indebug_infobased onAddress.debug_namescan quickly look up functions or variables by name.- Shared repeated information: repeated type definitions, strings, and similar data are stored in pools. Core information sections only reference offsets into those pools.
DWARF faces many challenges. The most obvious is storing complex information efficiently while making it easy for debuggers and tools to query. DWARF uses variable-length encoding, shared repeated information, and even a stack-based VM language to describe complex information. I think these techniques are worth borrowing when we face similar engineering problems. GDB also builds many additional indexes on top of DWARF's accelerated lookup design, ensuring good debugging experience even for very complex programs.
This concludes the basic introduction to DWARF. One disclaimer: my DWARF learning is still shallow, and I cannot guarantee every detail in this post is completely correct. Many details are not covered here, and I only half-understand some of them myself. But I am not worried. With AI and source code, enough time should solve things eventually. Also, when I am excited after gaming at night and cannot sleep, I only need to open the official DWARF documentation on my iPad for a while. I quickly become sleepy.
Back to GDB Itself
GDB's Limitations
At this point, most GDB principles are clearer. I want to review GDB's limitations, because to use a tool well, it is even more important to know its weaknesses. I think GDB's limitations mainly come from two aspects.
Many people have this experience: GDB becomes hard to use in scenarios with asynchronous timing dependencies or concurrency. It may affect reproduction, and we definitely should not use GDB to debug production services. Based on my rich experience with questionable behavior, secretly running pstack once on a production service probably goes unnoticed. These issues mainly come from the ptrace side of GDB being slow. The most intuitive point is that with ptrace, the debugger fully stops the traced process, then resumes it through signals. This is a standard stop the world operation. We cannot really blame ptrace. It is a debugger. It is supposed to stop the target process for interactive debugging.
What if we imitate pstack, write a silent GDB script, quickly execute it, collect information, and resume? We can ignore the complex interaction between debugger and debuggee, but there is another performance killer: how ptrace reads user-space data from the debugged process. GDB must use PTRACE_PEEKDATA to read target process memory, only eight bytes at a time. In slightly complex scenarios with large data, this means many system calls and context switches. Compared with interactive debugging, the context-switch cost we worried about becomes less important, but it is still there.
If GDB is limited by ptrace, can we replace that part? I have always had this idea and tried it in ghostscope. I attempted to replace ptrace with eBPF, use DWARF as the map, and use eBPF plus uprobe to capture and display data. Performance improves, but interactive debugging is lost. Every approach has its own scenario.
The other limitation is that DWARF, as a map, can sometimes be weak. Besides variables optimized away under high optimization, mentioned earlier, I also encountered poor inline-function support in a newer GDB 18.0.50 version. Breakpoints were not always set, or not set on all inline functions. In other words, under high optimization, the DWARF map can feel like it has ink smeared on it, hurting debugging experience. DWARF tries to map machine language back to the source-code world we understand, but compiler optimization makes this much harder. It is like a tug-of-war where you do not even know which side you should stand on, or which side you should hope wins.
GDB Remote Mode
You have probably heard of GDB remote mode. Simply put, as shown below, we run two GDB commands. GDB Server runs in the target process environment. GDB Client runs on a remote machine and provides normal GDB interaction. They communicate through RSP, Remote Serial Protocol. Note that using GDB from VS Code or Vim is not strictly GDB remote mode. It adds another layer on top of GDB Client: DAP, Debug Adapter Protocol, so the editor only needs one command interface for different debugging tools.
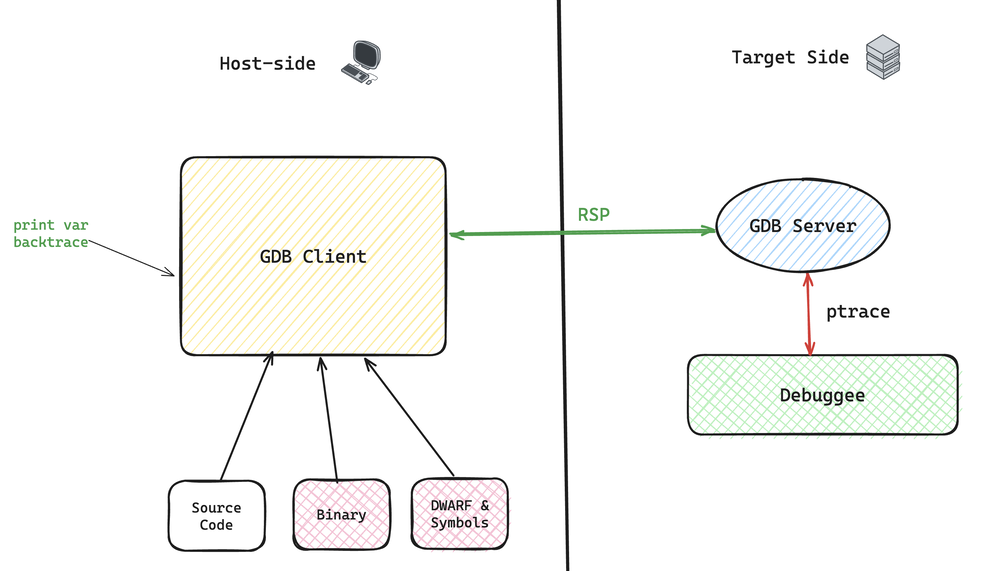
Now that we understand GDB basics, the idea is simple. ptrace is the part that lets GDB control the debugged process, so even in remote mode, ptrace must run in the target process environment. But DWARF, as the map, does not need to move to the target machine at all. It can be used remotely to analyze the user's GDB commands, decide what needs to be collected or modified, then send instructions to GDB Server to execute mechanically.
The benefits are clear. Security improves because DWARF contains lots of source information, and many companies do not want DWARF to leak freely. Public binaries are usually stripped, meaning DWARF is removed. In customer-environment debugging, GDB remote mode becomes especially useful. Also, keeping DWARF parsing and processing on the host side reduces pressure on the real runtime environment. If you dislike remote mode and wonder why these things are separated from the real environment, you can also SSH and run GDB directly. That is a spontaneous form of remote mode without extra GDB machinery.
Another point: GDB can display source code, through the list command or TUI mode. Seeing source code in real time helps debugging, which is why I like cgdb. But often, even when source code exists in our environment, GDB cannot display it correctly. A classic case: the binary was built in a production pipeline, while our environment has source code from git, so source display probably fails. We need to understand: how does GDB find source file paths?
The answer is simple. Source file paths are in DWARF. More precisely, each Compile Unit corresponds to one source file, and its attributes describe the absolute directory and the source file name with relative path. The root cause of the problem above is: the source path on the build machine differs from the source path on the debugging machine. GDB provides commands such as set substitute-path to remap source paths, ensuring GDB can find source directories on the debugging machine. After discussing source code, debug information, executable files, and processes above, and clarifying their existence and responsibilities, these GDB usage details become easy to understand.
Using GDB with AI Tools
Mainstream AI tools such as Claude Code, Codex, and Copilot can conveniently use GDB for debugging and analysis. I will share some of my daily scenarios.
The earliest thing I used ChatGPT for was writing GDB scripts. It was probably about a year after ChatGPT came out. I do not remember the exact time. I heard people say ChatGPT could write code, so I tried it. The result was good. Whether GDB scripts or more complex shell scripts, it could produce usable results within a few rounds of conversation. Back then, I did not foresee that AI tools would become as capable as they are now.
A GDB script is essentially a sequence of GDB commands. I think the main value is that it turns GDB from interactive usage into quiet continuous execution. Sometimes we need interactive debugging. Sometimes we only need to quickly or automatically collect information in an environment. I still remember when my senior colleague asked me to write a GDB script live during incident response, and I was sweating. Now I can safely hand that to AI.
My second frequent use case is core dump analysis. When a process crashes, the OS writes process state into a core dump: virtual address space data, register values at the time, /proc/maps content, and so on. With this information, GDB can reconstruct useful data such as the call stack at crash time. Usually, even without debug information, as long as symbols exist, the call stack can still be restored, but most functions show only raw offsets instead of source lines. If precise source information is needed and debug information is temporarily unavailable, I paste the corresponding assembly into ChatGPT and ask it to explain it, then read the source code and confirm the exact location. In the AI era, reading assembly is no longer an advanced trick. Just ask.
With AI Code Agents, core dump analysis becomes straightforward. The Agent can automatically locate the source line, then combine source code to determine how the issue should be fixed. If project build and end-to-end tests are easy for AI to run, the Agent can even build a fixed version, try to reproduce the issue, and confirm whether it is truly fixed. We only need to approve the final result: whether the root cause is correct, reproduction is accurate, the fix is reasonable, and no risk is introduced.
Using AI to drive GDB for debugging is often an end-to-end service now. It is convenient. But I believe that only by knowing where the information comes from and how conclusions are derived step by step can we use it with confidence and take responsibility for AI's output.
Good GDB Articles and Resources
Computer Systems: A Programmer's Perspective has a lab called Bomb Lab. It is very interesting and perfectly demonstrates how hard it is to obtain useful information without debug info. When I first learned computer science, I finished it in a confused way. Here is a new idea: try completing it together with AI. The process should be very smooth.
GDB from Naked to Fully Equipped summarizes many GDB configuration techniques. It is a good summary of practical techniques. The only pity is that I do not use Emacs. tmux + Vim + cgdb is already the limit of my performance.
how-does-gdb-call-functions explains how GDB implements the
callcommand. In some sense, it is JIT technology.
I still remember following this blog about extending GDB with Python and the official docs long ago to write Python scripts for displaying NGINX data structures. I did not understand much then and just thought it was magical. To be honest, I still do not understand that much more now.
I do not recommend the official docs here because there is a lot. In the AI era, people are less willing to read official documentation. At least I am. For practical command questions, just ask AI.
Epilogue
This post was written intermittently over two or three months, so it may feel a little disconnected. The outside world kept changing while I was writing, and my own focus shifted several times too.
Why did it take so long? One reason is that my ability is limited. Although the outline of this post had existed in my mind for a long time, writing it was still bumpy. I had to keep reading material and writing test programs to verify ideas. Even now that it is finished, I am still not fully satisfied. But after writing for so long, I might as well publish it. Because the post is already huge, many parts had to be cut temporarily, such as rust-gdb implementation details and how GDB itself supports multiple programming languages.
The other reason is that I must blame Clair Obscur: Expedition 33. During Christmas and year-end, I gave myself eight days off. I am not someone who likes traveling, and I usually prefer staying at home. I had planned many learning tasks. But then I saw Expedition 33 win Game of the Year, put all plans aside, and finished the game in one go. The game has extra meaning to me because, at my current age, I would have to join Expedition 33 too, otherwise I would be erased. That made me think about the meaning of life, though I did not reach an answer. It made me realize I know too little about humanities and social sciences. Maybe I should study the operating rules behind society the way I study low-level technical details, at least in one domain. So recently I have been learning blockchain. It may be against the trend, but it is meaningful to me, and I can also fill in some basic finance knowledge along the way.